Prometheus
Configure Prometheus to scrape Casdoor for runtime metrics (API throughput, latency, CPU, memory, etc.). Add a scrape job for the Casdoor backend:
global:
  scrape_interval: 10s

scrape_configs:
  - job_name: 'prometheus'
    static_configs:
      - targets: ['localhost:9090']
  - job_name: 'casdoor'
    static_configs:
      - targets: ['localhost:8000']   # Casdoor backend address
    metrics_path: '/api/metrics'
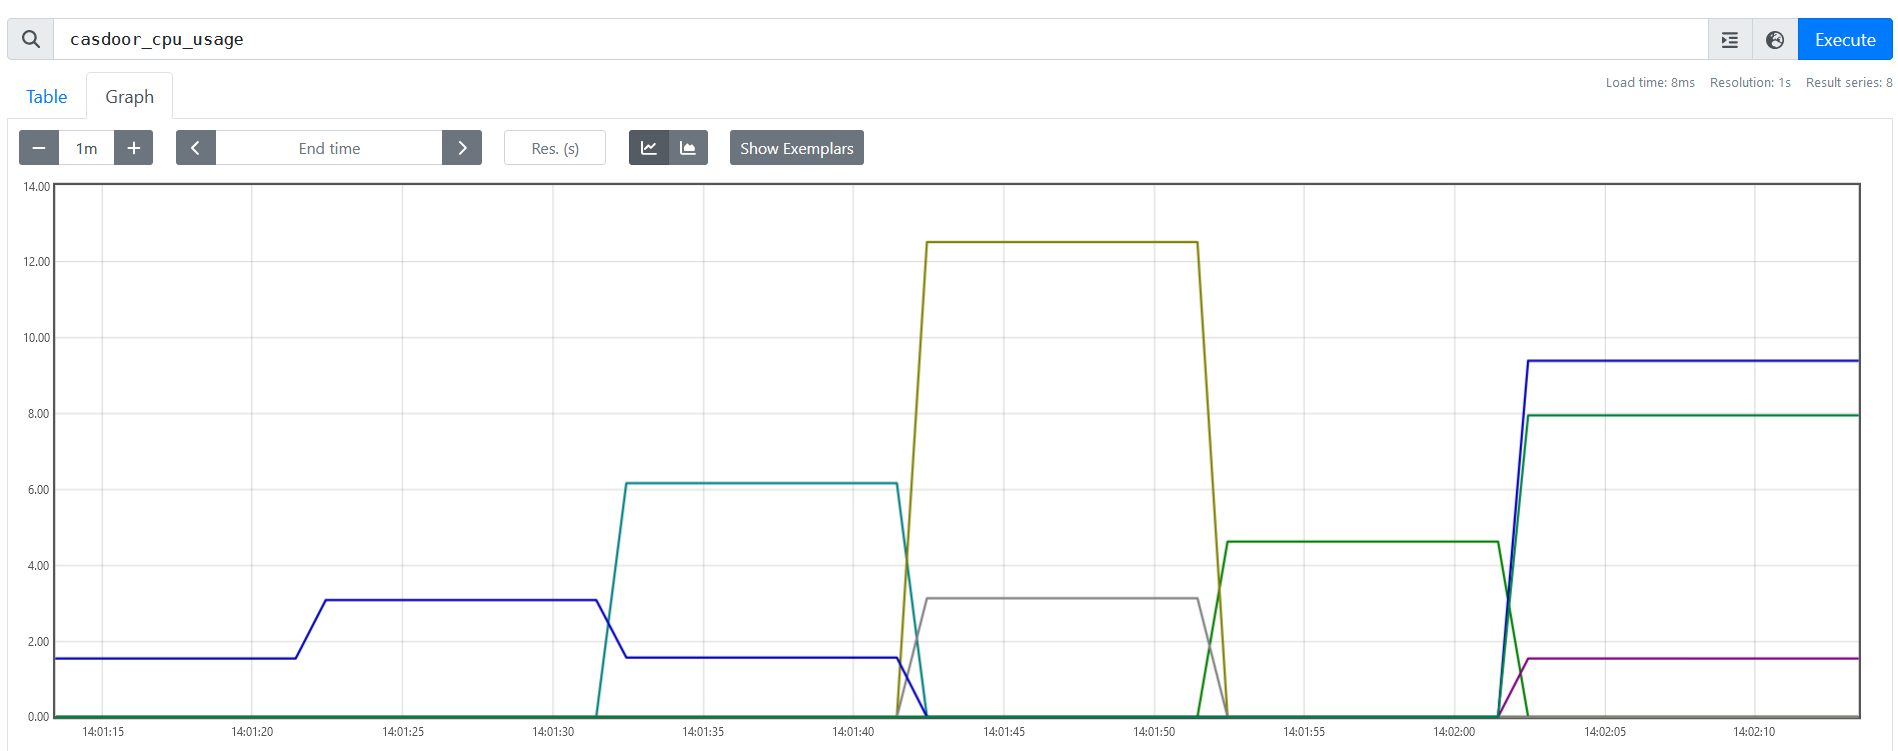
After Prometheus is running and scraping, you can query and visualize Casdoor metrics (e.g. in Grafana).